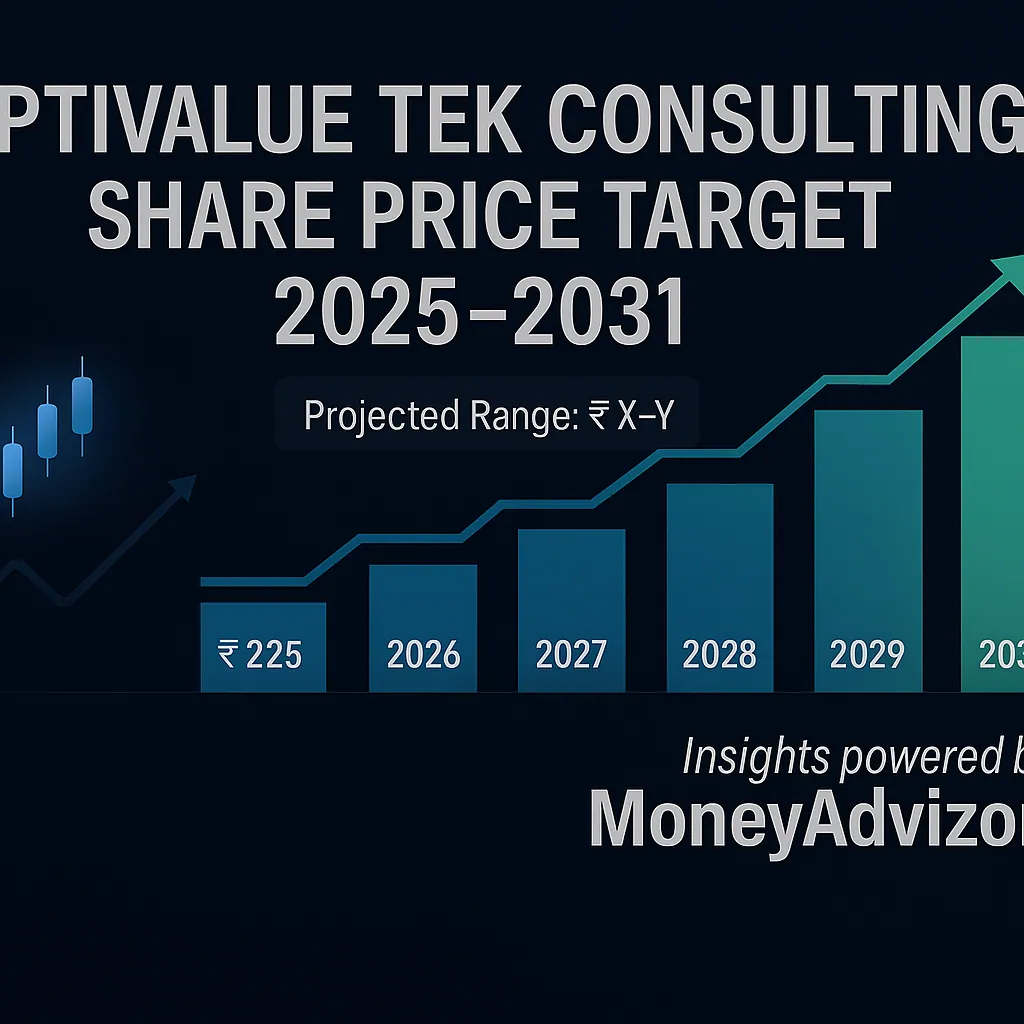
In the dynamic world of Indian IT consulting, small-cap companies often present a unique blend of high-growth potential and significant volatility. Optivalue Tek Consulting Limited (NSE: OPTIVALUE), a name that has been generating interest for its impressive financial ratios, sits squarely in this category. With a stock price hovering around ₹103 and metrics like a 54.9% ROCE turning heads, investors are naturally curious about its future trajectory.
This article provides a thorough, expert analysis and forecast for the Optivalue Tek Consulting share price from 2025 to 2031. We will dissect the company’s business model, financial health, industry positioning, and the potential risks and opportunities that could influence its stock price in the coming years. Our goal is to equip you with a data-driven perspective to make informed investment decisions.
Understanding Optivalue Tek Consulting: The Company Behind the Ticker
Before we dive into share price predictions, it’s crucial to understand what Optivalue Tek Consulting actually does. Established in June 2011 and based in Delhi, the company is not a traditional IT services firm. It positions itself as a technology consulting specialist focused on enterprise modernization and digital transformation.
Its core business profile includes:
- IT Consulting: Providing expert advice to businesses looking to upgrade their technology stack.
- Custom Software Solutions: Developing tailored software to meet specific client needs.
- Global Consulting Services: Offering its services to a diverse international clientele.
- Key Industries Served: Retail, Telecom, Banking, Financial Services, High Tech, and Energy.
This focus on high-value consulting and digital transformation, as opposed to pure commoditized services, is a significant positive differentiator in a crowded market.
Decoding the Current Financial Health (As of September 2025)
A snapshot of Optivalue’s current financial metrics reveals a story of exceptional operational efficiency, albeit with some questions for the future.
- Current Market Price: ~₹103
- Market Capitalization: ~₹197 Crores (Classifying it as a small-cap stock).
- Stock P/E (Price-to-Earnings Ratio): 16.2. This is interesting—it appears relatively low compared to its stellar growth ratios, potentially indicating undervaluation.
- Return on Capital Employed (ROCE): 54.9%. This is an exceptionally high figure. It indicates that the company is incredibly efficient at using its capital to generate profits.
- Return on Equity (ROE): 49.2%. Similarly outstanding, showing high profitability relative to shareholder equity.
- 52-Week High/Low: ₹108 / ₹102. The current price is very close to its yearly high, suggesting strong recent momentum.
The Takeaway: The standout numbers are ROCE and ROE. They paint a picture of a highly profitable and efficient company for its size. However, as a small-cap, these numbers can be more volatile, and sustaining them as the company scales will be the key challenge.
Industry Outlook and Growth Catalysts for Optivalue
The global digital transformation market is projected to grow at a compound annual growth rate (CAGR) of over 16% through this decade. As a niche player in this vast ecosystem, Optivalue is well-positioned to benefit from several tailwinds:
- Rising Demand for Digital Solutions: Businesses across banking, retail, and telecom are urgently modernizing legacy systems, creating a steady demand pipeline.
- Niche Expertise: Specialized consultants are often preferred over large, generalized firms for specific, high-impact projects.
- Scalability: A small base allows for rapid percentage growth from securing a few large new clients.
- Government Initiatives: Programs like “Digital India” continue to foster a supportive domestic environment for IT companies.
Key Risks and Challenges to Consider
Investing in small-caps requires a balanced view of the risks:
- Illiquidity: Lower floating stock can lead to high volatility and difficulty entering/exiting large positions without impacting the share price.
- Client Concentration: A reliance on a few large clients for a significant portion of revenue is a common risk for smaller consulting firms.
- Execution Risk: The inability to scale operations while maintaining high profitability (ROCE/ROE) could lead to de-rating.
- Macroeconomic Factors: Economic downturns can lead to clients delaying or canceling IT projects, directly impacting revenue.
- Competition: Intense competition from both large IT giants and other nimble small-cap firms.
Methodology Behind Our Share Price Forecast
Our forecast is not a mere guess. It is based on a blended valuation approach considering:
- P/E Multiple Expansion/Contraction: Analyzing if the current P/E of 16.2 is justified and how it might change with growth.
- PEG Ratio (P/E to Growth): Comparing the P/E ratio to the company’s earnings growth rate to assess relative value.
- Earnings Growth Projection: Estimating future earnings based on industry CAGR and company-specific factors.
- Technical Analysis: Considering historical support and resistance levels.
- Qualitative Factors: Incorporating the growth catalysts and risks mentioned above.
We model a scenario of high growth in the initial years (2025-2027) as the company gains traction, followed by a gradual normalization of growth rates and valuation multiples as the company matures in size.
Optivalue Tek Consulting Share Price Target 2025 to 2031
Optivalue Tek Consulting Share Price Target 2025
Annual Outlook: We expect 2025 to be a year of strong momentum. The company is likely to continue its current trajectory, reporting robust earnings growth. The market may start to assign a slightly higher valuation multiple (P/E) as recognition of its quality grows.
| Month | Predicted Price Target (₹) | Notes / Catalysts |
|---|---|---|
| Jan 2025 | 105 – 110 | Budget expectations; Q3 FY25 results anticipation. |
| Feb 2025 | 108 – 115 | Union Budget reaction; sector-specific announcements. |
| Mar 2025 | 110 – 118 | End-of-year rally; FY25 annual results anticipation. |
| Apr 2025 | 115 – 122 | FY25 results declaration. Positive results could trigger a jump. |
| May 2025 | 118 – 125 | Post-result momentum; guidance for FY26. |
| Jun 2025 | 120 – 128 | Q1 FY26 result expectations; steady growth. |
| Jul 2025 | 122 – 132 | Q1 FY26 results declared. |
| Aug 2025 | 125 – 135 | Sustained performance. |
| Sep 2025 | 128 – 138 | |
| Oct 2025 | 130 – 142 | Q2 FY26 results anticipation. |
| Nov 2025 | 132 – 145 | Festive season liquidity; result announcements. |
| Dec 2025 | 135 – 148 | Year-end consolidation; setting up for a new year. |
Optivalue Tek Consulting Share Price Target 2026
Annual Outlook: By 2026, the law of larger numbers begins to apply. While growth remains strong, the pace might moderate slightly. The market will focus on the company’s ability to maintain its high profitability metrics.
| Month | Predicted Price Target (₹) | Notes / Catalysts |
|---|---|---|
| Jan 2026 | 140 – 155 | Building on previous year’s momentum. |
| Feb 2026 | 145 – 160 | Budget-related sectoral boosts. |
| Mar 2026 | 150 – 165 | FY26 final quarter anticipation. |
| Apr 2026 | 155 – 172 | FY26 annual results. A key test for sustainability. |
| May 2026 | 160 – 178 | FY27 guidance is crucial for future outlook. |
| Jun 2026 | 165 – 183 | Steady state operation. |
| Jul 2026 | 168 – 188 | Q1 FY27 results. |
| Aug 2026 | 172 – 192 | |
| Sep 2026 | 175 – 196 | |
| Oct 2026 | 178 – 200 | Q2 FY27 anticipation. |
| Nov 2026 | 180 – 205 | |
| Dec 2026 | 182 – 208 | Year-end review. |
Optivalue Tek Consulting Share Price Target 2027
Annual Outlook: This period could see a potential consolidation phase. The company might be investing heavily in new capabilities or geographic expansion, which could pressure short-term margins but is healthy for long-term growth.
| Month | Predicted Price Target (₹) | Notes / Catalysts |
|---|---|---|
| Jan 2027 | 185 – 210 | |
| Feb 2027 | 190 – 216 | |
| Mar 2027 | 195 – 222 | |
| Apr 2027 | 200 – 230 | FY27 results. Focus on margin trajectory. |
| May 2027 | 205 – 235 | |
| Jun 2027 | 208 – 240 | |
| Jul 2027 | 212 – 245 | Q1 FY28 results. |
| Aug 2027 | 215 – 250 | |
| Sep 2027 | 218 – 255 | |
| Oct 2027 | 222 – 260 | |
| Nov 2027 | 225 – 265 | |
| Dec 2027 | 228 – 268 |
Optivalue Tek Consulting Share Price Target 2028-2031: Long-Term Vision
From 2028 onwards, we project Optivalue to mature into a established mid-tier IT consulting player. Growth will become more stable and in line with the industry average. The premium valuation multiple might stabilize.
- 2028 Year-End Target Range: ₹250 – ₹320
- Rationale: Sustainable growth, possible expansion into new verticals or geographies. The P/E multiple could stabilize between 20-25 if growth is consistent.
- 2029 Year-End Target Range: ₹300 – ₹400
- Rationale: Continued execution on a larger scale. The company could start paying dividends, attracting a new investor base.
- 2030 Year-End Target Range: ₹380 – ₹500
- Rationale: A well-established brand in its niche. Growth through acquisitions could become a theme.
- 2031 Year-End Target Range: ₹475 – ₹650
- Rationale: By 2031, if Optivalue successfully executes its strategy without major hiccups, it could be a multi-bagger from current levels. This target factors in a CAGR of approximately 25-30% over the 7-year period, which is ambitious but possible for a high-quality small-cap.
Final Verdict and Investment Advice
Is Optivalue Tek Consulting a good buy for the long term?
Based on our analysis, Optivalue Tek Consulting presents a high-risk, high-reward investment opportunity. Its current financial efficiency is outstanding, and it operates in a high-growth industry. The potential for significant capital appreciation from its small base is substantial.
However, investors must be cautious. The risks inherent in small-cap investing, such as volatility, liquidity, and execution risk, are very real.
Recommendation:
- For aggressive investors with a high-risk appetite and a long-term horizon (5+ years), Optivalue could be a small, strategic part of a diversified portfolio.
- Conservative investors should wait for more consistent performance history, larger scale, and reduced volatility before considering an investment.
Disclaimer: This article, including the share price targets and forecasts, is for informational and educational purposes only. It is not a direct recommendation to buy or sell any security. The stock market is subject to risks. Please conduct your own thorough research and consult with a qualified financial advisor before making any investment decisions. The author and publisher hold no responsibility for investment decisions made based on this article. Past performance is not indicative of future results.


